




- Published on: 2026-08-27 02:59:00
A Practical Guide to Reading a Trading Chart | TradingPRO
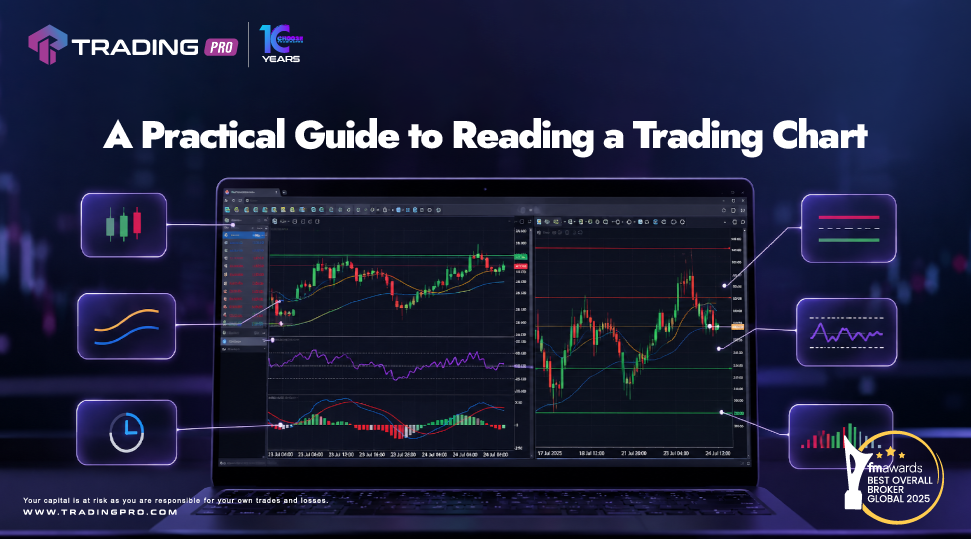
Trading charts provide a visual representation of price movements and are an important part of following financial markets. For TradingPRO users, understanding how to read a chart can make it easier to interpret market activity across currencies, gold, commodities, indices, shares, and other available instruments.
TradingPRO provides access to MT4 and MT5, where users can explore different chart types, timeframes, and technical-analysis tools. Learning how these features work can help users develop a more structured approach to observing market movements and understanding the information displayed on their screens.
What Is a Trading Chart?
A trading chart displays how the price of an instrument has changed over a selected period. Depending on the chart type and timeframe, users can observe short-term movements or review longer periods of market activity.
Through TradingPRO's MT4 and MT5 platforms, users can select different instruments and timeframes to examine market behavior. This flexibility allows users to look at the same market from different perspectives rather than relying on a single timeframe.
Understanding what a chart represents is the first step toward using it effectively. A chart does not simply show whether a price has moved up or down; it can also provide information about the speed, direction, and pattern of price movements.
Understanding Candlestick Charts
Candlestick charts are one of the most widely used chart types in financial-market analysis. Each candlestick represents price activity over a specific period and can show the opening, closing, highest, and lowest prices during that timeframe.
TradingPRO users can access candlestick charts through MT4 and MT5 and adjust the timeframe according to the type of market activity they want to examine. This can help users understand how price behavior develops from one period to the next.
Individual candlesticks can provide useful information, but they are generally more meaningful when considered as part of a broader sequence. Looking at several candles together can help users identify changes in direction, periods of increased activity, or areas where price has repeatedly reacted.
Choosing the Right Timeframe
Timeframes are an important part of chart analysis. A short timeframe may display detailed price movements over a relatively brief period, while a longer timeframe provides a broader view of market activity.
With TradingPRO's MT4 and MT5 platforms, users can switch between multiple timeframes depending on what they want to observe. Comparing different timeframes can provide additional context and help users understand how short-term movements relate to broader market behavior.
For example, a movement that appears significant on a short-term chart may look relatively small when viewed over a longer period. Using multiple timeframes can therefore help create a more complete picture.
Understanding Trends
A trend describes the general direction in which price has been moving over a particular period. Charts can show periods where prices are generally moving upward, downward, or within a relatively defined range.
TradingPRO users can use charting tools on MT4 and MT5 to observe these different market conditions. Trend lines and other visual tools can also help users organize what they are seeing on the chart.
However, markets do not always move in a straight line. Prices can move in different directions within a broader trend, which is why it is important to consider multiple factors rather than relying on one visual signal.
What Are Support and Resistance Levels?
Support and resistance are commonly used concepts in technical analysis. Support generally refers to an area where price has previously found buying interest, while resistance refers to an area where price has previously encountered selling pressure.
TradingPRO users can identify and mark potential support and resistance areas directly on charts using available platform tools. Observing how price behaves around these areas can provide additional context when studying historical market activity.
These levels are not guaranteed points where prices will reverse. Instead, they are areas that traders often monitor because previous price behavior may make them relevant to future market analysis.
Using Technical Indicators With TradingPRO
Technical indicators can provide additional information about price behavior. TradingPRO's MT4 and MT5 platforms provide access to a range of indicators that users can apply to their charts.
Common examples include Moving Averages, RSI, and MACD. Each indicator uses price-related information in a different way and can be used to examine aspects such as trends, momentum, or changes in market behavior.
Understanding what an indicator measures is important before adding it to a chart. Using too many indicators at once can make a chart difficult to read, so TradingPRO users may find it useful to focus on tools that serve a clear analytical purpose.
Understanding Moving Averages
Moving averages are commonly used to smooth price data and make broader trends easier to observe. By calculating an average price over a specific number of periods, a moving average can provide a simplified view of how prices have developed.
Through TradingPRO's MT4 and MT5 platforms, users can add moving averages to charts and adjust their settings according to the timeframe they are analyzing.
Moving averages can be useful for understanding historical price behavior, but they should not be treated as guarantees of future market direction. They are one analytical tool that can be considered alongside other information.
Understanding RSI and Market Momentum
The Relative Strength Index, commonly known as RSI, is a technical indicator used to measure the strength and speed of recent price movements.
TradingPRO users can add RSI to their MT4 and MT5 charts to examine momentum and compare it with recent price behavior. Learning how RSI works can help users understand another dimension of chart analysis beyond simply looking at price.
As with other indicators, RSI is best considered as part of a wider analysis process. Economic events, market news, broader trends, and other factors can all influence market activity.
Understanding MACD
The Moving Average Convergence Divergence, or MACD, is another widely used technical indicator. It compares moving averages to provide information about changes in momentum and trends.
TradingPRO users can access MACD through MT4 and MT5 and use it alongside price charts to examine how market momentum has developed over time.
Rather than relying on MACD alone, users can compare its information with price action, other indicators, and relevant economic developments to build a more complete view of market conditions.
Why Economic News Still Matters
Technical analysis is only one way of looking at financial markets. Economic data, central bank decisions, geopolitical developments, and major financial news can all influence market conditions.
TradingPRO users can combine chart analysis with an Economic Calendar and market information to understand the broader context behind price movements. For example, a significant price change may coincide with an economic announcement, providing additional context for what is happening on the chart.
This combination of chart-based analysis and awareness of economic developments can help users avoid looking at price movements in isolation.
Keeping Charts Clear and Organized
A chart can quickly become difficult to interpret if it contains too many indicators, drawings, and visual elements. TradingPRO users can customize their MT4 and MT5 charts according to the information they want to monitor.
A clean chart can make it easier to focus on price behavior and the specific indicators being used. Rather than adding every available tool, users can choose the features that are most relevant to their individual approach.
Organizing charts by market or timeframe can also make regular market monitoring more efficient.
Using Multiple Tools for a Broader View
No single chart or indicator can explain every market movement. TradingPRO provides access to multiple tools that can be used together to develop a broader perspective.
Users can combine candlestick charts, timeframes, technical indicators, economic calendars, and market information to examine different aspects of market activity.
This approach can help users distinguish between short-term price movements and broader market developments while continuing to build their understanding of financial markets.
Building Your Chart-Reading Skills With TradingPRO
Reading a trading chart is a skill that develops with practice and familiarity. The more users understand chart types, timeframes, trends, support and resistance, and technical indicators, the easier it can become to interpret the information displayed on a platform.
TradingPRO provides access to MT4 and MT5, along with charting and analytical tools that users can explore as they develop their market knowledge.
The objective is not to predict every price movement. Instead, understanding charts can help users organize market information, recognize patterns in historical price activity, and develop a more informed perspective on changing market conditions.
Continue Exploring Financial Markets With TradingPRO
A trading chart is more than a visual representation of price. It is a tool that can help users organize information about market activity and examine how prices have behaved across different periods.
With TradingPRO's MT4 and MT5 platforms, users can explore charts, technical indicators, multiple timeframes, and other market-monitoring features within one environment.
Whether you are beginning to explore chart analysis or looking to strengthen your existing knowledge, developing a better understanding of charts can be a valuable part of your financial-market learning journey.
Explore TradingPRO's platforms and tools and continue building your understanding of global financial markets.
Instagram | X / Twitter | Facebook | Telegram | LinkedIn


