



- Published on: 2026-10-23 14:31:00
Understanding Candlestick Charts in MetaTrader 4: A Complete Beginner Guide
For new forex traders entering the financial markets, raw price numbers alone tell very little story. To make sense of constant price fluctuations, professional traders rely on visual charting methods. Among all available options on MetaTrader 4 (MT4), the Japanese candlestick chart stands out as the single most popular and powerful tool for evaluating market sentiment.
Candlestick charts do far more than track where price has been. They reveal the ongoing tug of war between buyers pushing prices higher and sellers driving prices lower. By learning how to interpret individual candles and multi-candle formations, you gain actionable insights into market dynamics, potential trend reversals, and trade execution timing.
In this comprehensive guide, you will learn the fundamental mechanics of Japanese candlestick charting. We will explore how an individual mt4 candlestick is constructed, break down foundational single and double candle patterns, show how to combine price action with a trendline mt4 overlay, and help you build a clean analytical workflow on your trading desktop.
TradingPRO provides access to the MT4 platform alongside a beginner friendly trading environment, giving market enthusiasts the ideal foundation to analyze global markets with confidence.
The History and Importance of Candlestick Analysis
Candlestick charting dates back to 18th century Japan, where rice trader Homma Munehisa discovered that while supply and demand influenced prices, market sentiment and trader emotions played an equally critical role. He created a visual system to record price highs, lows, opens, and closes over specific time intervals.
Centuries later, Steve Nison introduced Japanese candlesticks to the Western financial world. Today, candlestick charting is integrated into virtually every electronic trading workstation globally.
Understanding candlestick charts matters because:
- Visual Efficiency: Unlike line charts that only display closing prices, a candlestick gives you a complete picture of market volatility within a single bar.
- Instant Sentiment Recognition: Color coded candle bodies let you determine who controlled the market during that period in milliseconds.
- Psychological Map: Extreme price highs and lows marked by candle wicks reveal where buyers or sellers aggressively stepped in to reject price moves.
TradingPRO supports traders learning MT4 by delivering reliable price data feeds, ensuring that every candle rendered on your chart reflects precise market pricing.
Anatomy of an MT4 Candlestick
Every mt4 candlestick generated on your chart displays four fundamental data points for a specific timeframe: Open (O), High (H), Low (L), and Close (C), collectively known as OHLC data.
High Price (Upper Wick Tip)
|
+-----------+
| |
Open Price -| Real |- Close Price (Bullish Candle)
| Body |
+-----------+
|
Low Price (Lower Wick Tip)
-
The Real Body
The wide rectangular portion in the center of the candlestick is called the real body. It represents the price range between the period opening quote and the period closing quote.\- Bullish Candle: Formed when the closing price finishes higher than the opening price. In default MT4 settings, this is often represented as a hollow or green candle body.
- Bearish Candle: Formed when the closing price finishes lower than the opening price. In default MT4 settings, this is displayed as a solid black or red candle body.
-
The Wicks (Shadows)
The thin lines extending above and below the real body are called wicks or shadows.- Upper Wick: The top tip marks the highest price level traded during the candle timeframe.
- Lower Wick: The bottom tip marks the lowest price level traded during the candle timeframe.
Essential Candlestick Patterns Every Beginner Should Know
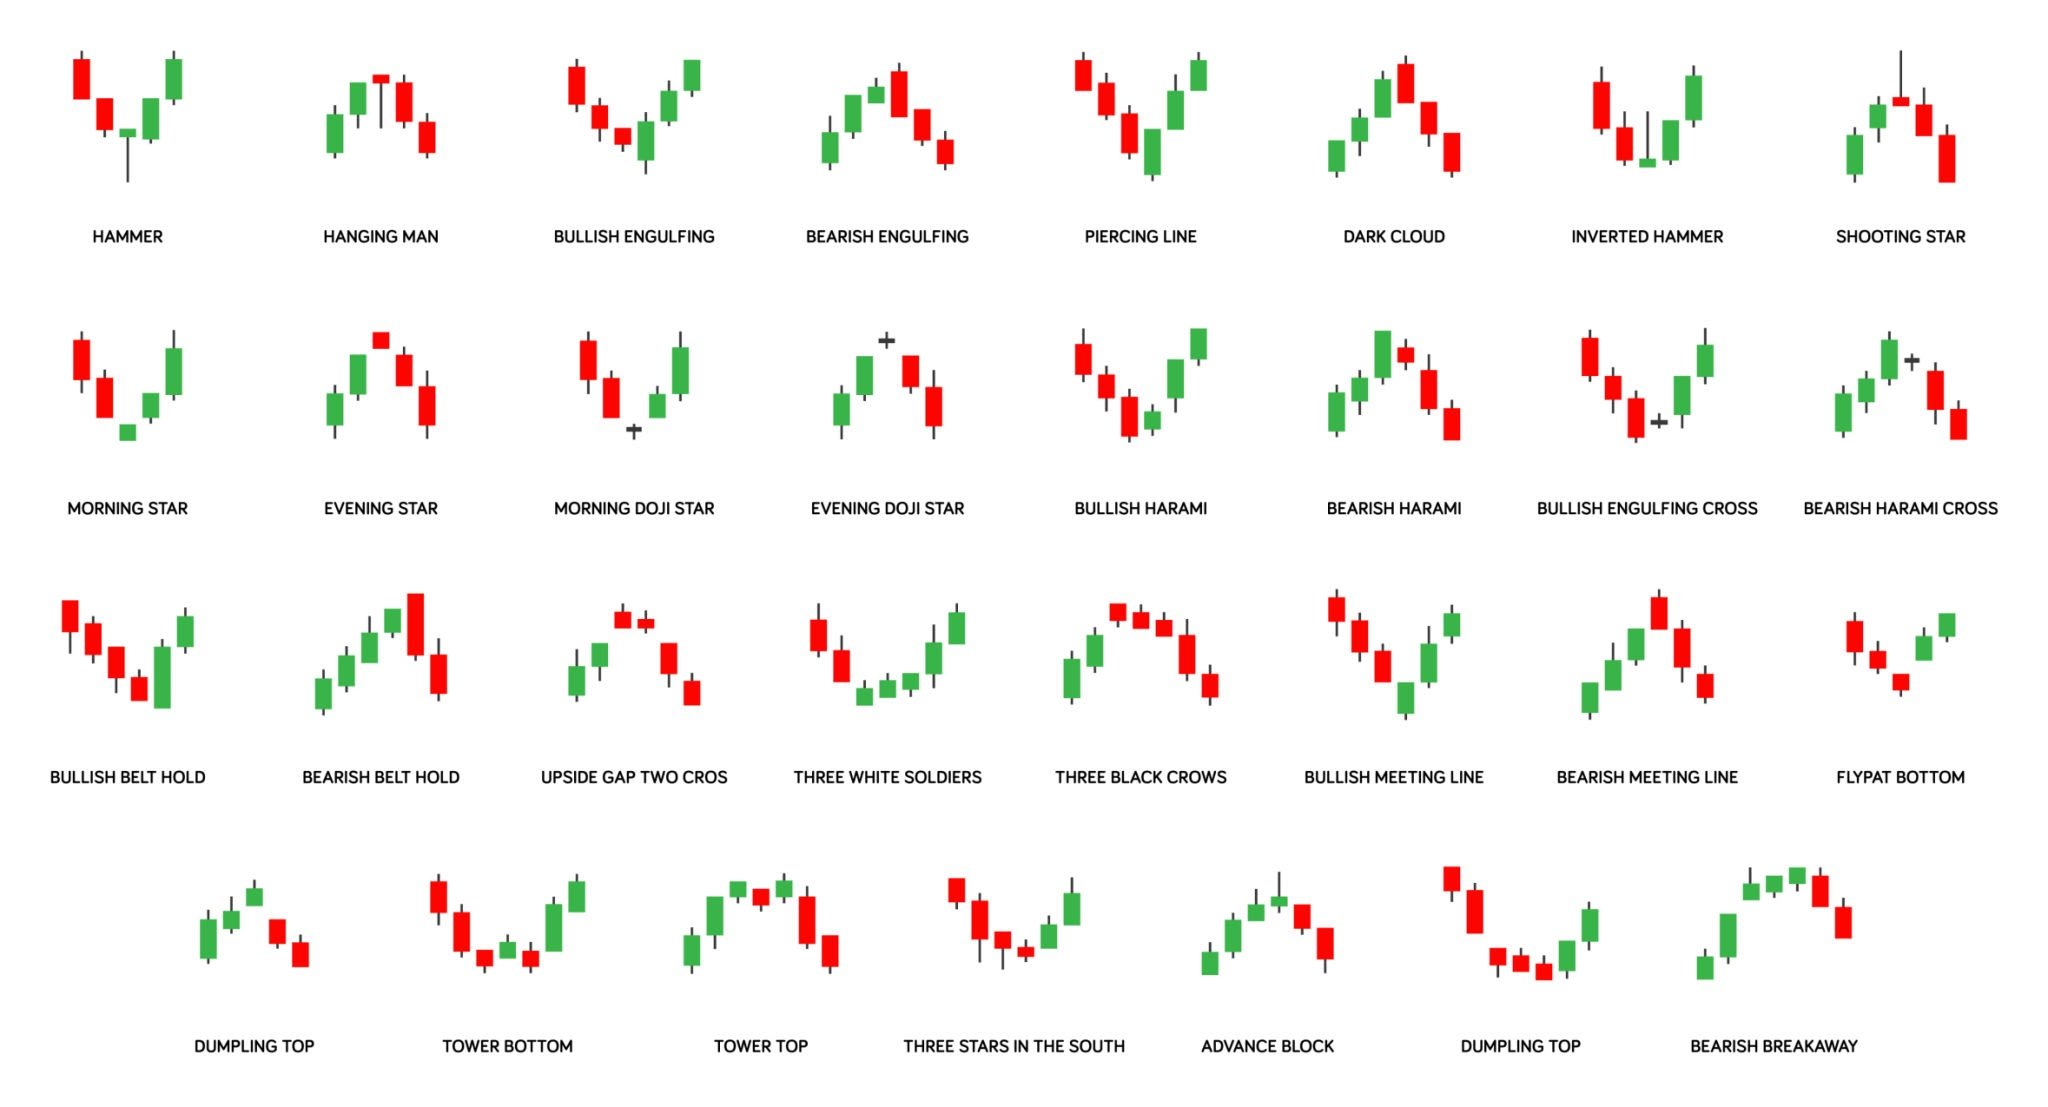
Candlestick shapes vary based on market volatility and trader conviction. Recognizing common candle formations allows you to anticipate potential price continuations or reversals.
Single-Candle Patterns
The Hammer (Bullish Reversal)
A Hammer features a small real body near the top of the price range and a long lower wick at least twice the length of the body. It typically forms at the bottom of a downtrend, signaling that sellers pushed prices aggressively lower, but buyers stepped in forcefully to drive price back up before the candle closed.
The Shooting Star (Bearish Reversal)
The inverse of a Hammer, a Shooting Star features a small real body near the bottom of the price range and a long upper wick extending upward. Appearing at the top of an uptrend, it indicates that buyers tried to push prices higher, but strong selling resistance pushed the price back down.
The Doji (Indecision)
A Doji forms when the opening price and closing price are virtually identical, leaving a paper thin horizontal line as the body. A Doji reflects total market equilibrium where neither buyers nor sellers hold dominance.
Double-Candle Patterns
Bullish Engulfing
A two-candle reversal pattern occurring during a price decline. The first candle is small and bearish. The second candle is a large bullish candle whose real body completely engulfs the body of the preceding bearish candle, signaling a strong shift in buying momentum.
Bearish Engulfing
Occurs at the peak of an upward move. A small bullish candle is immediately followed by a large bearish candle whose body completely covers the prior candle body. This indicates that sellers have overwhelmed buyers and taken control of market direction.
| Pattern Name | Number of Candles | Trend Context | Expected Market Bias |
| Hammer | 1 | Downtrend Bottom | Bullish Reveal |
| Shooting Star | 1 | Uptrend Top | Bearish Reversal |
| Doji | 1 | Anywhere | Indecision/Neutral |
| Bullish Engulfing | 2 | Downtrend Bottom | Strong Bullish Shift |
| Bearish Engulfing | 2 | Uptrend Top | Strong Bearing Shift |
Combining Candlesticks with a Trendline Overlay in MT4
While reading an individual mt4 candlestick yields valuable short term clues, trading single patterns in isolation can lead to false signals. Professional technical analysis combines candlestick patterns with key structural tools like trendlines.
A trendline mt4 setup provides structural context by showing you the prevailing directional bias of the market.
- Draw the Master Trendline:Toolbar drawing object.
Select the Trendline tool from the MT4 Line Studies toolbar. Connect at least two major price swing lows in an uptrend (or two swing highs in a downtrend). - Monitor Price Approaching the Line:Wait for structural retests.
Allow price to move back toward your drawn trendline mt4 boundary. Avoid placing trades blindly before price interacts with the line. - Identify Candlestick Confirmation:Look for reversal candles.
Watch how candles form as they touch the trendline. Look for confirmation patterns like a Hammer, Long Lower Wick, or Bullish Engulfing candle bouncing off line support. - Execute Trade with Risk Controls:Order entry and risk management.
Enter your trade in the direction of the confirmed bounce. Place your Stop Loss order just beyond the outer wick of the confirmation candlestick to protect your capital.
By requiring candlestick patterns to align with trendline boundaries, you drastically filter out weak market noise and focus only on high probability trade setups.
TradingPRO supports traders learning MT4 by offering access to forex and other supported markets through MT4, allowing you to practice technical analysis across multiple asset classes seamlessly.
Practical Best Practices for Beginners
- Trade in the Direction of the Main Trend: Candlestick reversal patterns carry significantly higher reliability when they align with the higher timeframe trend.
- Never Ignore the Close: Always wait for a candlestick to close before making a trading decision. A candle that looks like a strong Hammer mid-period can easily collapse into a bearish bar before the timeframe ends.
- Use Multiple Timeframes: Identify major candlestick structures on daily or 4-hour charts, then refine trade entry timing on 1-hour or 15-minute charts.
- Keep Chart Layouts Readable: Adjust your MT4 chart settings (press F8) so that candle bodies stand out clearly against your background without visual clutter.
Common Beginner Mistakes to Avoid
- Trading Every Single Pattern: Spotting a Doji or Hammer in the middle of a choppy sideways range often yields no actionable direction. Only trade patterns that occur at key support or resistance zones.
- Confusing Bar Charts with Candlesticks: While bar charts share OHLC data, candlestick bodies make momentum shifts far easier to digest during real time trading.
- Neglecting Stop Losses: Even the cleanest Bullish Engulfing pattern can fail due to sudden market news. Always attach strict risk management orders to every trade.
Frequently Asked Questions (FAQ)
What is the difference between a hollow candle and a solid candle in MT4?
In standard MT4 color setups, a hollow (or green) candle body represents a bullish move where price closed higher than it opened. A solid (or red) candle body represents a bearish move where price closed lower than it opened.
How do I switch my MT4 chart to show a candlestick view?
Select your active chart, then press Alt + 2 on your keyboard, or click the Candlestick icon located on the main MT4 charts toolbar.
Why do candlestick patterns sometimes fail?
No technical pattern works 100% of the time. Financial markets are influenced by shifting liquidity, economic news releases, and institutional order flow. Candlesticks should always be combined with broader context like a trendline mt4 setup or support level.
Does a long wick mean a trend is reversing?
A long wick indicates price rejection. For instance, a long lower wick shows that sellers tried to drive prices down, but aggressive buying demand pushed price back up. While it signals rejection, confirmation from the next candle is always recommended before entering a position.
Can I practice reading mt4 candlestick charts on a demo account?
Yes. Brokers like TradingPRO offer free MT4 demo accounts where you can practice identifying candlestick patterns and drawing technical lines using virtual funds in real market conditions.
Conclusion
Mastering Japanese candlestick charts is one of the most effective ways to understand market psychology and price action in MetaTrader 4. By learning the anatomy of an mt4 candlestick, identifying reliable single and double candle patterns, and confirming setups along a trendline mt4 boundary, you can turn complex market price movements into a structured trading plan.
As you gain experience reading price charts, pairing your technical analysis skills with a reliable, feature-rich broker becomes essential.
TradingPRO provides a beginner friendly trading environment with fast execution, transparent pricing, responsive support, and full access to MetaTrader 4.
Ready to refine your chart reading skills? Open an account with TradingPRO today, download MetaTrader 4, and start analyzing live financial markets with confidence.


